Manual - Debugging Up
 Contents   News   View 

Quantum Debugger Previous Next

Quantum Debugger

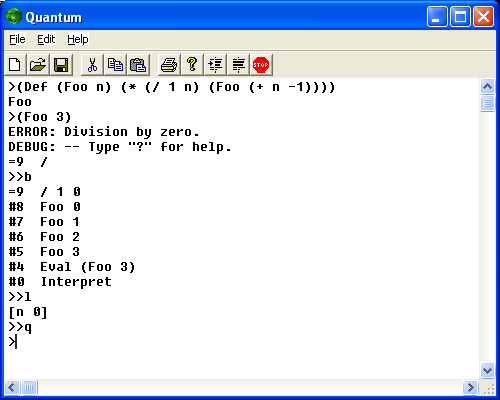
Start Quantum again and reproduce what you see in the Quantum session below.

The Quantum debugger is called indirectly in various ways (e.g. Error) when you make mistakes.  The Quantum debugger can also be called directly by Evaluating (Debug) or mouse clicking the Quantum Interpreter's stop button.  The most useful Quantum debugger commands to know are q ("Get me out of here!") and v (verbose backtrace).  Next most useful are l, e x, u, and d for looking at stack frame environments, Evaluating expressions, and moving up and down the Evaluation stack.

Information Commands:
?, h, Help   Type "?" for help.
l, Look    Look at selected stack frame.
e x, Eval x    Evaluate expression x.

Execution Commands:
q, Quit   Abort program.
c, Continue   Continue program.
s, Step   Continue to next Eval.
i, Into    Continue to next scope.
n, Next   Continue to next Eval at current level.
f, Finish    Finish scope of selected stack frame.
r x, Return x   Return (Eval x) from selected stack frame.

Stack Commands: b, Backtrace   Print backtrace.
v, Verbose    Print verbose backtrace.
t, Terse   Print terse backtrace.
u, Up    Select caller stack frame.
d, Down    Select callee stack frame.
g n, Go n   Select stack frame n.

Reference Manual: Debugging


©2004-2024 Planet Quantum Kelly Roach